Crypto Fundamental Analysis: 4 Key Metrics and a Complete On-Chain Framework
04月 24, 2026
No earnings reports, no EPS — can you still do fundamental analysis on crypto? This guide breaks down a 5-step framework and explains the 4 core factors from Artemis' quantitative research to help you find tokens with real on-chain fundamentals.
Stock investors know the drill — flip open the earnings report, check EPS, P/E ratio, balance sheet. But crypto has none of that. Sometimes you can't even figure out what a token is actually for. Does that mean you're stuck trading on rumours and gut feelings? Not at all. Crypto does have fundamentals. They're just not in a financial report — they're on-chain. This guide walks you through a practical framework for analysing crypto from scratch, then unpacks the quantitative research published by on-chain analytics platform Artemis in March 2026. Their factor model — built entirely on on-chain fundamentals — achieved a Sharpe ratio of 1.73 over a 4-year backtest. By the end of this article, you'll know how to identify whether a token has real fundamentals, and exactly where to look.
Not Every Crypto Has Fundamentals Worth Analysing
Let's get this out of the way first: crypto assets vary enormously, and not all of them are suitable for fundamental analysis. Some tokens are backed by real, functioning systems — layer-1 blockchains, DeFi protocols, decentralised infrastructure networks. These have users, generate transaction activity, and produce trackable revenue. These are the ones you can analyse. Others — pure meme coins, tokens with no clear utility — are driven almost entirely by sentiment, narrative, and liquidity flows. There's no fundamental dimension to cut into. To decide whether a token is worth analysing fundamentally, ask four questions:
Is there a clearly defined product or service behind it? Is there ongoing, observable usage behaviour? Is there trackable fee or revenue data? Does the protocol have a mechanism that returns value back to token holders?
The more boxes checked, the more meaningful a fundamental analysis becomes. If the answer to all four is no, fundamental analysis simply isn't the right tool.
The Universal Framework: Position → Demand → Revenue → Value Capture → Valuation
Once you've confirmed a token is worth analysing, work through these five layers in order.
Layer 1: Position — What Is It, and What Problem Does It Solve?
Start with the basics: what type of protocol is this, and what does it actually do? Is it a layer-1 blockchain? A DeFi lending protocol? A decentralised perpetuals exchange? An AI infrastructure network? For initial classification, check the tags on CoinGecko, CoinMarketCap, or Artemis. For deeper product understanding, go to the official documentation or coverage from credible crypto media. This step gets skipped constantly — but it's the foundation of everything else. If you don't understand what you're looking at, no amount of data will make the analysis meaningful.
Layer 2: Demand — Is Anyone Actually Using It?
Having a product doesn't mean people use it. This layer is about finding real usage data on-chain:
DAU / MAU (Daily / Monthly Active Addresses) Transactions (number of on-chain transactions) Volume (total value transacted) Inflow / Outflow (capital moving in and out)
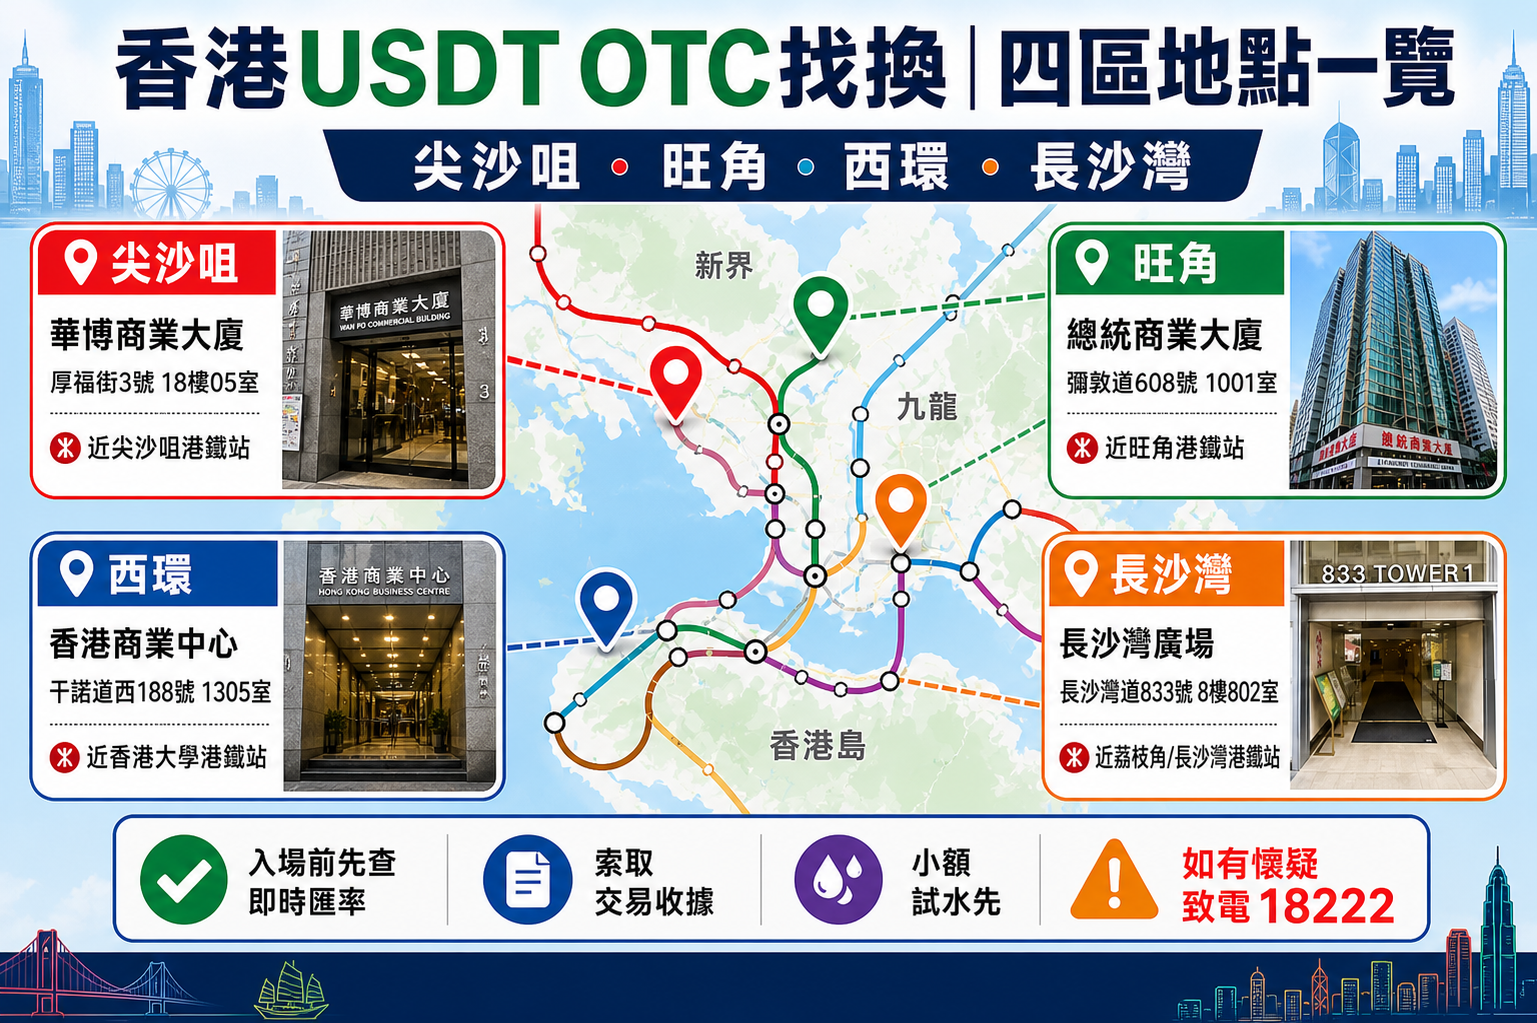
Key platforms for this data: DeFiLlama, Artemis, Token Terminal, Dune Analytics. When reading usage numbers, don't just look at a single snapshot. What matters is the trend — has this number been growing, flat, or declining over the past few months? Growing usage signals real demand expanding. A practical example: in Hong Kong, a large number of money changers (找換店) process USDT transactions via on-chain transfers as part of their daily OTC operations. Every one of those trades shows up in on-chain transaction counts and fund flow data. The more active the money changer market, the more it reflects genuine local USDT demand — not just numbers on a screen, but real capital moving through the chain.
Layer 3: Revenue — Is It Actually Generating Income?
Usage alone doesn't mean revenue. This layer looks at:
Fees: The total amount users pay to use the protocol — equivalent to gross revenue Revenue: What the protocol actually keeps after paying out incentives and sharing fees with other parties — closer to gross profit, though still not net profit
You need to look at both. If Fees are high but Revenue is near zero, the protocol is heavily subsidising its users — and that's not sustainable. Also dig into why revenue is surging. Is it driven by genuine user demand, or by a short-term airdrop campaign? Once incentives end, usage often collapses just as fast.
Layer 4: Value Capture — Does Protocol Revenue Actually Matter for the Token?
This is the most overlooked layer in crypto analysis — and the one most unlike traditional stock investing. A protocol generating strong revenue does not automatically mean its token has value. Shareholders have legal claims on company profits. Token holders often don't. You need to check the tokenomics model specifically for value capture mechanisms:
Does the protocol distribute a portion of revenue to stakers? Does it use revenue to buy back and burn tokens (reducing supply, adding buy pressure)? Does increased usage naturally drive demand for the token itself?
If none of these exist, the token is essentially a brand mascot. You're buying into a narrative, not the protocol's fundamentals. This is a fundamental difference between crypto and equities that many investors miss.
Layer 5: Valuation — Is the Current Price Reasonable?
Only after completing the first four layers does valuation make sense. Common on-chain valuation metrics include:
MC / Fees: Market cap divided by annualised fees — conceptually similar to a P/E ratio MC / Revenue: Market cap divided by annualised revenue P/S Ratio: Market cap relative to protocol service revenue
Comparing these figures across different protocols rarely works well — the nature of each protocol is too different. A more effective approach: compare a protocol's current ratio to its own historical average. Is it trading cheap or expensive relative to where it's been? This is exactly the mean reversion logic Artemis builds into their model.
The Artemis Quantitative Study: 4 Core Predictive Factors
In March 2026, Artemis published a quantitative factor research paper. Starting from 25 candidate metrics, they eliminated weak predictors and overlapping signals, ultimately landing on four low-correlation, complementary core factors. These four factors powered a weekly-rebalanced long/short portfolio — long the top 20% by fundamentals, short the bottom 20%. Backtested from February 2022 to 2026, the portfolio achieved a Sharpe ratio of 1.73, with raw returns of +126% during the 2022 bear market alone.
Factor 1: DAU Growth
DAU measures daily active addresses. What this factor tracks is the trend in that number, not the absolute level. Is the user base expanding? This is one of the most straightforward signals of real, growing demand. A protocol with modest DAU but consistent 15%+ monthly growth often deserves more attention than a stagnant market leader. User growth momentum is exactly the kind of signal that market pricing tends to be slow to reflect.
Factor 2: Revenue Quality
This one is counterintuitive. The factor measures how much of a protocol's revenue comes from passive sources — MEV extraction, liquidations, incentive subsidies — rather than from users actively choosing to use the protocol. The research found that protocols with a higher proportion of passive revenue tended to perform better in the short term. The likely explanation: heavy incentives attract fresh capital, which drives short-term price appreciation. The practical implication is worth noting: short-term traders might watch incentive cycles closely, but long-term holders should be cautious — once subsidies taper off, the usage they propped up often disappears with them.
Factor 3: Revenue Stability
Also counterintuitive: protocols with more volatile revenue growth showed higher predicted returns in the backtest. This aligns with the risk premium concept in traditional finance. Markets demand higher compensation for uncertainty, so they price volatile assets lower — which creates more upside potential. In practice, a protocol with unstable revenue may be underpriced by the market and have room to mean-revert upward. The trade-off is that you'll need to stomach more volatility along the way.
Factor 4: MC / Fees Mean Reversion
Market cap divided by annualised fees — the closest crypto equivalent to a P/E ratio. Artemis doesn't use this to compare protocols against each other. Instead, they compare each protocol to its own historical average. If the current MC / Fees is below the protocol's multi-year historical mean, it signals relative cheapness with mean reversion potential. If it's above, the protocol may be overvalued relative to its own baseline. The core logic: market valuation tends to anchor around a historical centre of gravity. When it drifts too far, it tends to correct back.
What These Four Factors Tell Us
The backtest also reveals an important trend: as the market has matured, alpha from this model has compressed. Annualised raw returns exceeded 120% in 2022 and 2023 — by 2024 and 2025, that had narrowed to 15–40%. The reason is straightforward: as more capital adopts fundamentals-based strategies, markets price them in faster, and excess returns shrink. This doesn't make fundamental analysis irrelevant. It means the market is gradually incorporating fundamentals into pricing — and the investors who understood this early captured the largest edge. The advantage now is smaller, but it still exists for those willing to do the work.
The Limits of Crypto Fundamental Analysis
A few important caveats before you run with this framework: It cannot predict short-to-medium term price movements. Even a protocol with exceptional fundamentals can drop sharply due to macro sentiment, liquidity contractions, or unexpected events. On-chain data can be manipulated. Some protocols inflate DAU and volume through wash trading and self-dealing. Always cross-reference multiple data sources and flag statistical anomalies. Token models can change at any time. A revenue-sharing mechanism that exists today can be removed by governance vote tomorrow. Tokenomics are not legally binding financial obligations. Strong fundamentals don't mean strongest recent returns. During bull market peaks, narrative and sentiment dominate. Fundamentals-based strategies often underperform during these periods — sometimes significantly.