
Bitcoin Stuck at the $117,000 Level: Can the Fed’s Decision Spark a New High?
09月 19, 2025
Gold has surged to a record high, equities have defied earnings warnings, and the U.S. dollar is starting to weaken. Risk assets appear poised to continue their climb. Yet, Bitcoin—typically the most active beneficiary during periods of loose liquidity—has slipped to just below the $117,000 level. Despite strong market momentum—ETFs absorbing billions of dollars, stable coin balances piling up on exchanges, and long-term holders gradually reducing supply.
Something still seems to be missing?
A closer look at Week 37 of 2025 (September 8–14) reveals the answer.
Last week, Bitcoin closed the CME August futures gap at $117,000, then stalled between accumulation and price discovery after two weeks of major macroeconomic developments. The market did rally, marking its first back-to-back weekly gains in over two months. However, Bitcoin continues to struggle with the $117,000 resistance level, as traders await a pivotal event: the Federal Reserve’s decision on September 17.
This uncertainty comes against a complex economic backdrop. Two weeks ago, U.S. employment data came in weaker than expected. Now, inflation signals are mixed. The Producer Price Index (PPI) cooled, turning negative on a monthly basis—suggesting supply-chain cost pressures are easing. By contrast, the Consumer Price Index (CPI) told a different story: August CPI rose 0.4% month-over-month, pushing the annual rate to 2.9%, the highest since February. That figure remains well above the Fed’s 2% target, underscoring that inflation is far from defeated.
PPI data point to easing future inflationary pressures, but CPI shows households are still under strain. Coupled with a weakening labor market, the case for rate cuts remains strong. According to CME’s FedWatch tool, markets have priced in more than a 95% probability of a cut.
Meanwhile, other assets are stealing the spotlight. Gold has soared past $3,640 per ounce, setting a fresh record high. In equities, both the S&P 500 and Nasdaq hit all-time highs ahead of the upcoming Fed meeting.
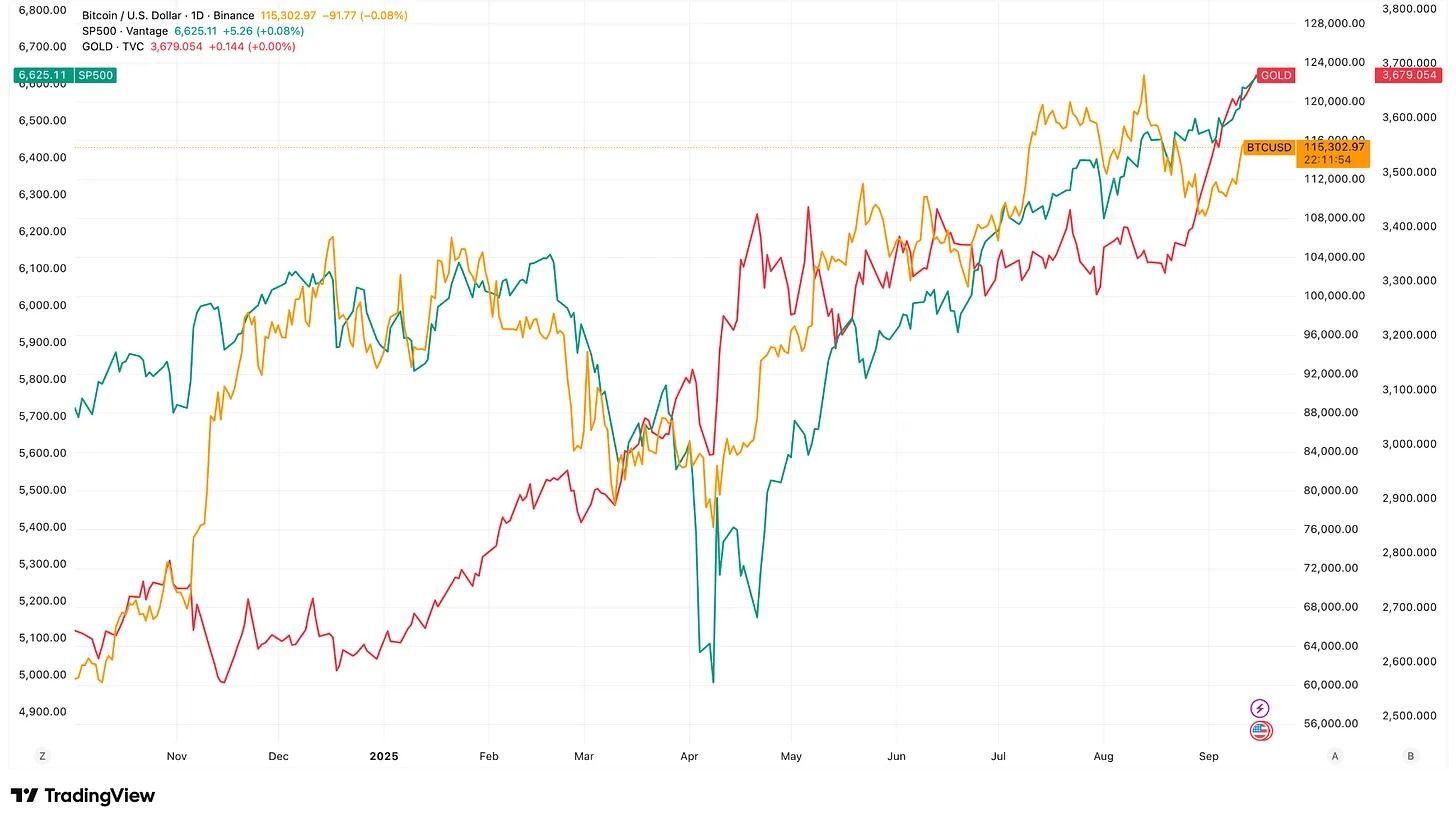
Bitcoin has been attempting to follow the same trajectory.
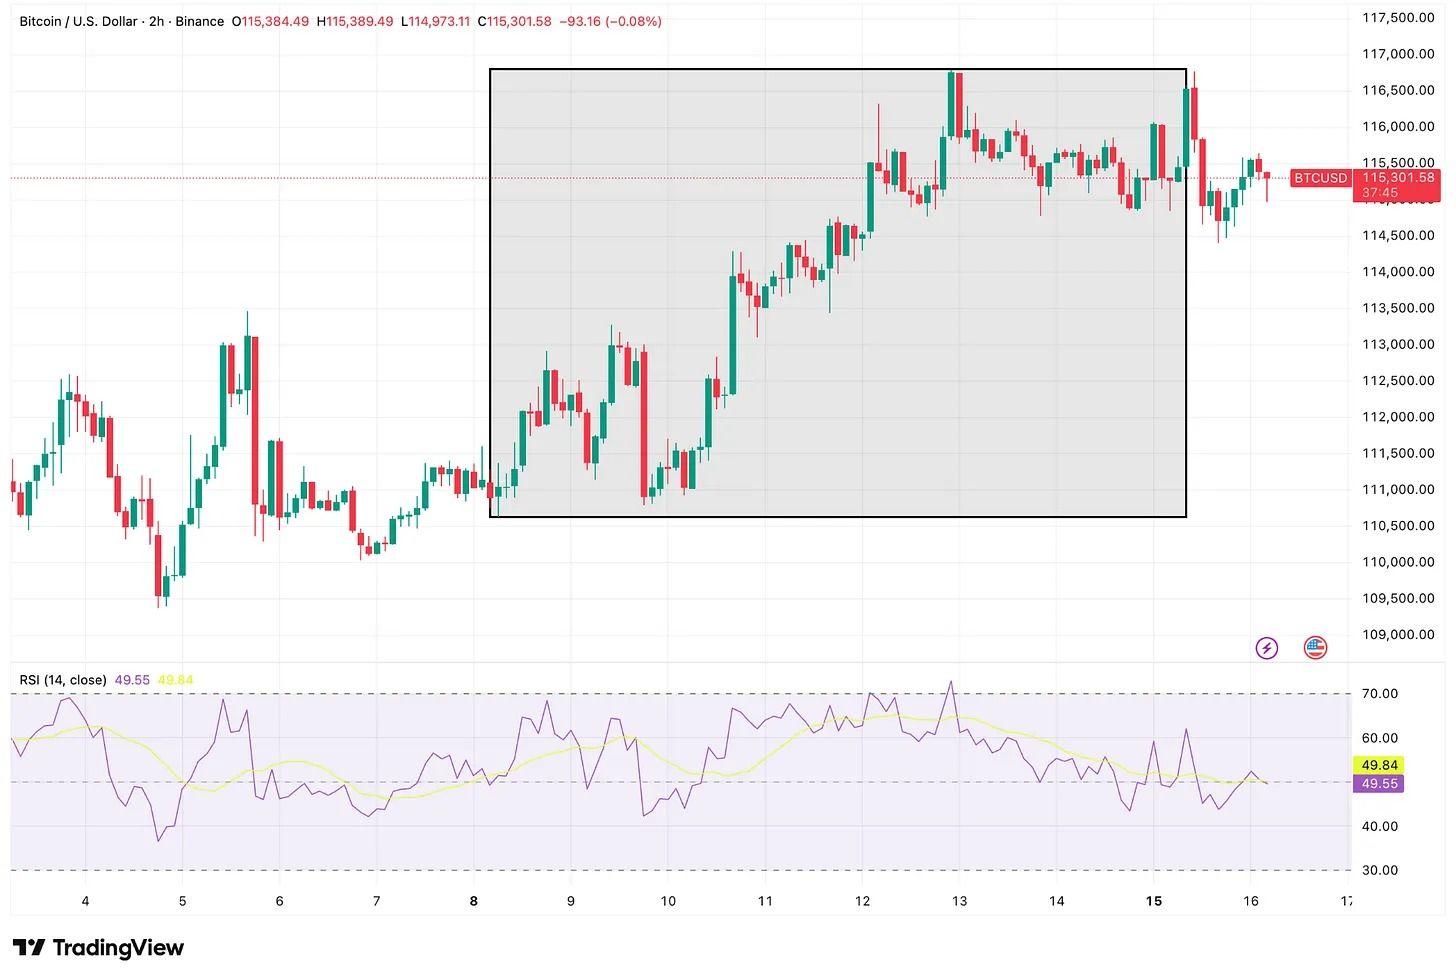
From a late-August low near $108,000, it rebounded to above $116,000 last week. However, unlike gold or equities, Bitcoin failed to break through that level. The gap has been filled, and upward momentum is building, yet the $117,000 resistance remains stubborn.
Throughout the week, Bitcoin held above $110,000, ending Sunday night with a 3.81% weekly gain.
In just five days, spot Bitcoin ETFs absorbed more than $2.3 billion, marking the strongest week since July and the fifth-best week of 2025. Institutional investors are supporting the bid, deploying fresh capital to build positions.
However, the derivatives market has not shown the same level of confidence.
Open interest in Bitcoin futures grew only slightly, while speculative energy shifted toward Ethereum and other altcoins. Bitcoin’s dominance dropped by 0.7 percentage points, reflecting this shift.
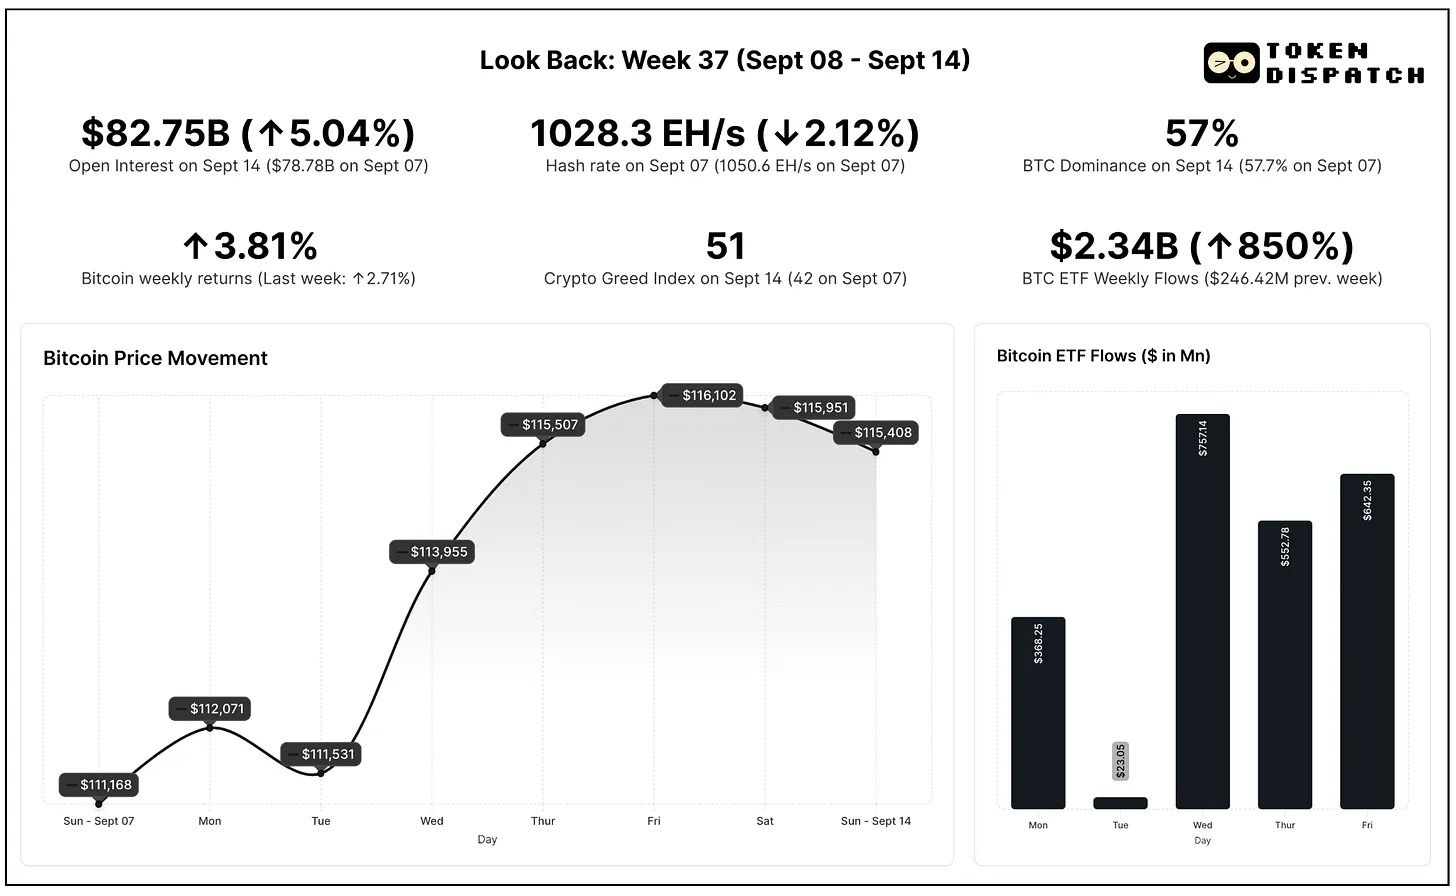
The Crypto Fear & Greed Index rose by 9 points, moving into the neutral zone and away from fear, signaling strengthening investor sentiment.
On-chain data aligns with this, showing that liquidity is waiting for market conviction.
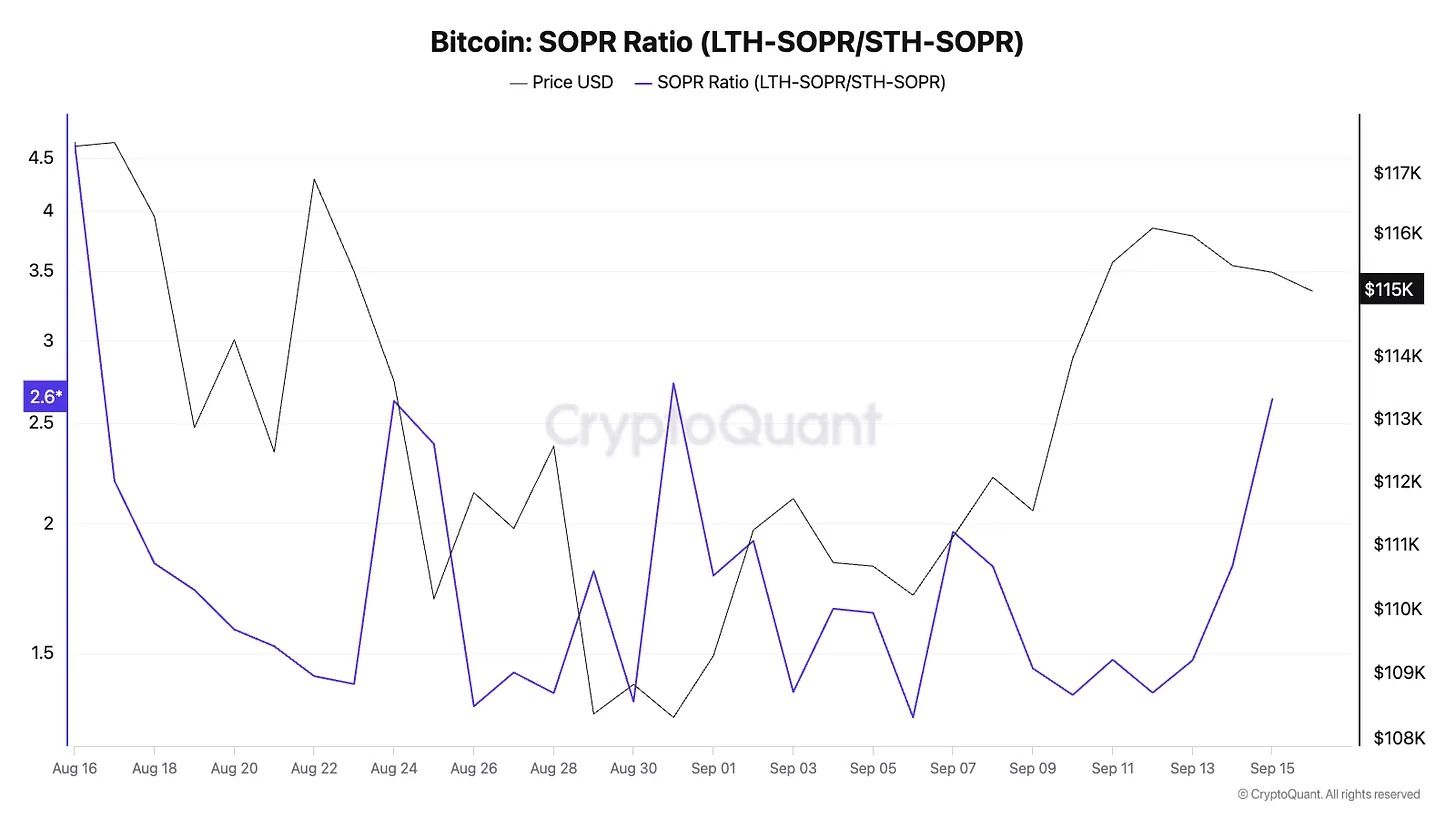
The Spent Output Profit Ratio (SOPR) indicates that long-term holders continue to take profits, while short-term holders are back to selling in profit rather than at a loss. This suggests healthy market liquidity, with supply flowing and no stress signals being released.
The Long-Term Holder / Short-Term Holder SOPR ratio remains elevated, showing that selling pressure is primarily coming from experienced wallets rather than anxious new entrants.
This week, the Market Value to Realized Value ratio (MVRV) rose from 2.09 to 2.17, indicating that Bitcoin is in a mid-cycle phase. Historically, MVRV levels between 3.5 and 4 have typically signaled an overheated market. At around 2.2, Bitcoin is neither cheap nor excessively stretched — valuations remain stable rather than bubble-like.
Meanwhile, the Stable coin Supply Ratio (the ratio of total crypto market cap to all stable coins in circulation) has dropped to its lowest level in four months. This suggests that, relative to Bitcoin balances, there is an increased amount of idle stable coin liquidity sitting on exchanges, waiting to be deployed.
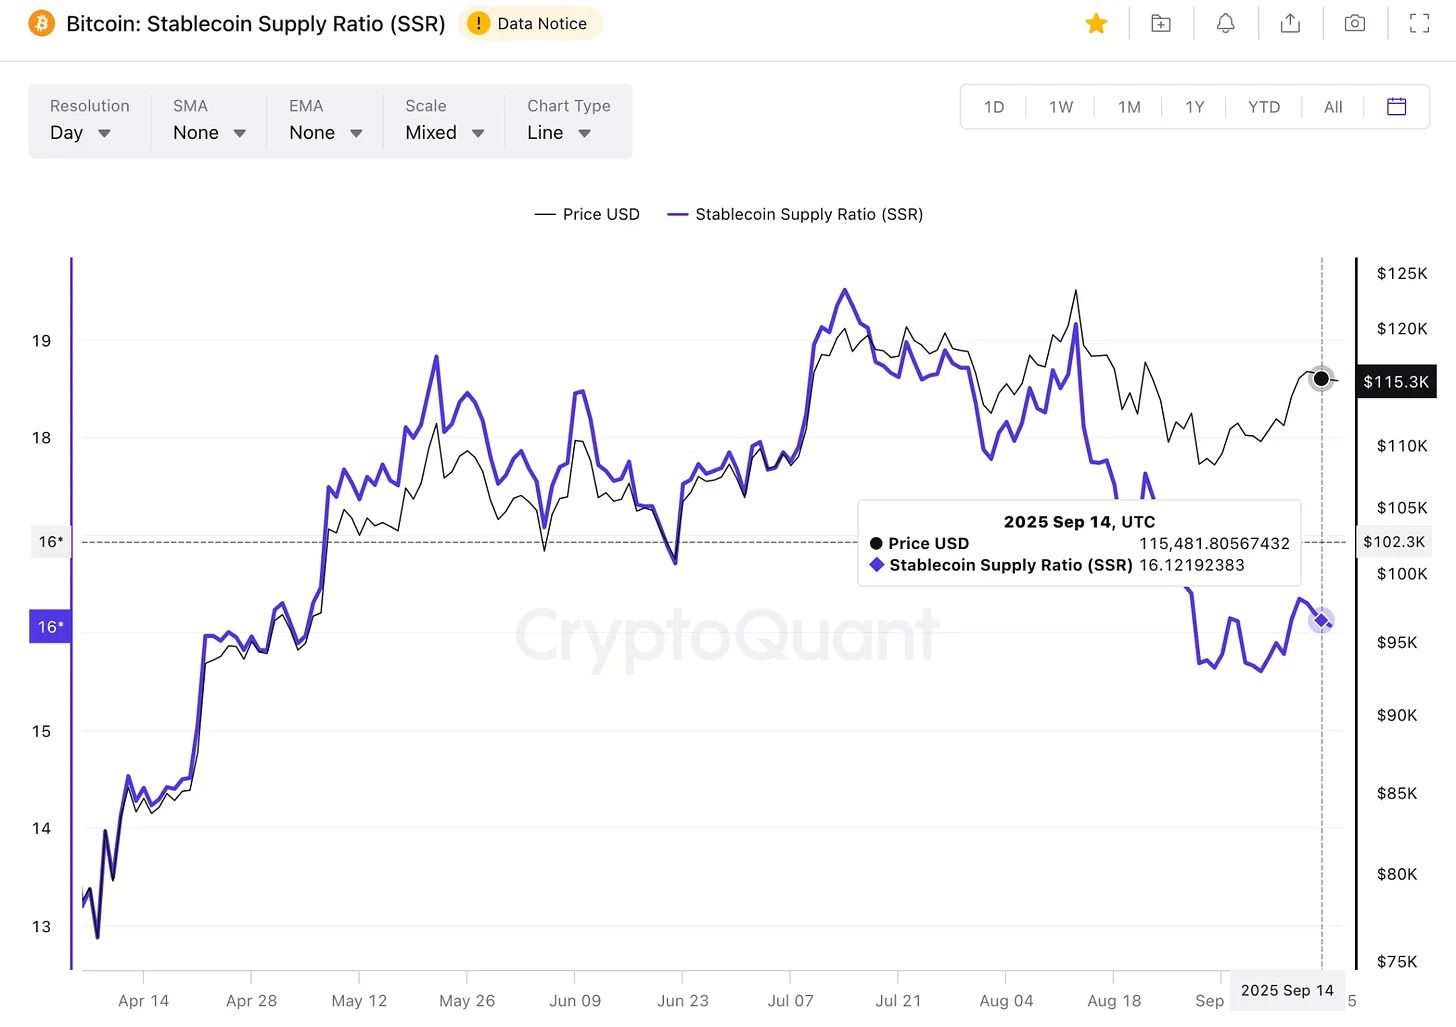
The short-term Relative Strength Index (RSI) has also fallen to around 50, indicating neutral momentum with room for upside. All of these data points support the broader view of ample liquidity, yet the market still lacks conviction.


